Posts

Showing posts from September, 2023

What is Nifty Bees ?

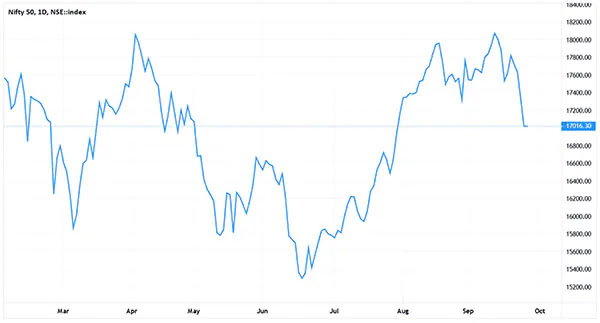
 Hello friends. let's understand passive. Nifty Bees is the very first exchange traded fund (ETF) launched in India, and it tracks the Nifty 50 Index. It was introduced in India by Benchmark Asset Management in December 2001. After some change of hands, it now belongs to Nippon India Mutual Fund. The “Nifty” in its name represents the index that it tracks and Bees is short for ‘benchmark exchange traded scheme’. Let’s take a step back and take a quick look at ETFs and the Nifty 50 index. Nifty 50 Index The Nifty 50 index is one of the two most widely used indices for the Indian markets, with the other being the Sensex. The Nifty (a combination of NSE and Fifty) 50 indices , is a diversified benchmark index that tracks the performance of the top large-cap companies listed on the NSE. It is owned and managed by NSE Indices Limited and as the name indicates, comprises 50 stocks covering 13 sectors. It is computed using the free float market capitalization method and its value is calcu...

What Is Breakout Pattern in Technical Analysis?

Image
 Hello friends. lest s understand most demanding pattern in stock market  Breakout Pattern    Breakout in Technical Analysis refers to when the price of an asset moves above a resistance area or moves below a support area. Breakout Patterns are commonly associated with ranges or other chart patterns. This includes triangles, wedges, head and shoulders, flags etc.  Breakout patterns may initiate long positions or exit short positions if the price breaks above the resistance.  Breakout patterns may initiate short positions or exit long positions if the price breaks below support. Learning about Breakout Patterns and identifying potential breakout stocks gives traders one more tool that they can use to generate profits. Price action within the share market is affected by supply and demand when a breakout signal occurs this usually means here the buyer has succeeded in pushing the stock’s price above the resistance level. If there is a downside or negative brea...

How to Use a Trading Journal to Improve your Trading skills

Image
 Hello friends. let's understand. the most    needed  How to Use a Trading Journal to Improve your Trading skills Introduction A trading diary is a detailed account of what happened during the course of a trading day. It can be used to track and analyze the trader's performance and help improve it. A trader can use this diary to keep track of the trades they made, the reasons behind them, their emotions at the time, and their thoughts and feelings throughout the day. The trading diary is one of the most important tools in a trader's arsenal. It allows them to see how they are performing in real-time as well as to identify any patterns that might exist in their trading habits. Daily-Trading Strategies The first thing that you need to do before starting to trade is to set up a trading plan. The second step is to create your day trader journal template. It should include the following: Date and time - Entry and exit points for the trade, as well as profit or...

Technical Analysis for beginners in Stock Market Trading

Image
 Technical Analysis for beginners in Stock Market Trading Hello friends One more topic for stock market enthusiast. You can win stock market without this let's understand below topic. Technical analysis is a way to study the history of a security in order to predict its future price. It is one of the most reliable ways to find out what the market thinks about a security. Technical analysis can be used for predicting the future behavior of an asset, and it helps traders make more informed decisions. This article will provide you with some basic information about technical analysis and how you can use it in your own trading. Technical analysis is the study of past market data with the goal of making predictions about future prices. Technical analysts usually use charts to analyze stocks, futures, commodities, and currencies. They look for patterns in trading volume, price changes and other information that might help predict future trends. In the stock market, chartists study the pri...

What is pivot points in stock market trading?

Image
 Hello friends lets understand one more Topic. What is pivot points in stock market trading? Pivot points are a technical trading tool used to identify support and resistance levels. They are based on the concept of "support" and "resistance". Pivot points are one of the most popular indicators in forex trading. They are used to identify potential turning points in the market and make predictions about future price movements. Some traders use pivot points as a way to forecast upcoming price movements while others use them as a way to enter or exit the market. Pivot points plays a crucial role in stock market trading. It is calculated based on the previous day trading session data like high, low and close price of the instrument. Pivot point calculation gives the pivot point, three support points & resistance points of the instrument for the next trading session. With the help of pivot points, we can predict the price movement of an instrument whether the price w...

What is Arbitrage fund ?

Image
Hello  friends  one more topic to understand  Arbitrage funds   now lets understand  What Is Arbitrage? All You Need To Know About Arbitrage Funds Arbitrage involves the simultaneous purchase and sale transactions of an asset in two different markets (i.e., cash and futures markets) to profit from inefficiencies in the prices across these markets. And the funds that work on this principle are called Arbitrage Funds. Although the mechanism may sound complex to a layman, it’s pretty straightforward once you understand the cash market and futures market. Let’s first understand the two markets a bit better. Cash market Also known as the spot market, this is the market where transactions are settled on the spot. For instance, think of the secondary equity markets. When you buy shares on the NSE, your account is debited with the funds, and your transaction is settled on the spot. Futures Market A futures market, as the name suggests, is a market where you can buy...

High-dividend paying PSU stocks that can reward shareholders handsomely

Image
  Hello  friends ope all are doing well  Here are some PSU stocks with high dividend yields Indian Oil  SAIL REC  ONGC  NALCO  BPCL  NMDC GAIL PTC India Power Finance Corporation Coal India  Balmer Lawrie Investment Hudco  Oil India  Hindustan Petroleum Wise investing  grow with knowledge