Technical Analysis for beginners in Stock Market Trading
Technical Analysis for beginners in Stock Market Trading
Hello friends One more topic for stock market enthusiast.
You can win stock market without this let's understand below topic.
Technical analysis is a way to study the history of a security in order to predict its future price. It is one of the most reliable ways to find out what the market thinks about a security.
Technical analysis can be used for predicting the future behavior of an asset, and it helps traders make more informed decisions. This article will provide you with some basic information about technical analysis and how you can use it in your own trading.
Technical analysis is the study of past market data with the goal of making predictions about future prices.
Technical analysts usually use charts to analyze stocks, futures, commodities, and currencies. They look for patterns in trading volume, price changes and other information that might help predict future trends. In the stock market, chartists study the price of a stock over time in an effort to identify potential areas for growth or decline. Technical analysts may also use charts to predict trends that might affect industry wide movements. These data may include How many calls a company receives each year Distance from the current price to the highest price in the past 6 months.
How Technical Analysis Works
Technical analysis is a type of trading that is based on studying past price movements and future predictions. It is primarily used to predict the direction of a market or asset, help predict support and resistance levels, and identify potential targets for buy or sell orders. Most traders use technical analysis as a tool that helps them make more informed decisions about the stock market. Technical analysis is a discipline that studies past price movements and the future predictions based on these data. It is primarily used to predict the direction of a market or asset, help predict support and resistance levels, and identify potential targets for buy or sell orders.
How to Read a Chart
Technical analysis is a trading technique that is used to evaluate securities by analyzing the statistics of their price movements. Technical analysts use charts to identify patterns that can be interpreted as buy or sell signals. The analysis is based on the assumption that all information about a security is reflected in its price movement.
A line chart is a type of chart that plots two or more series of data as a series of points connected by straight lines. The data points are plotted on the horizontal axis and the corresponding values are plotted on the vertical axis. Line charts are used to compare changes in value over time, such as changes in stock prices over time.

A bar chart takes the step of using vertical lines with horizontal lines spouting out of them, rather than just a dot. This makes it much more informative than a line chart. The top of each line in a body signifies the day high price of the stock while the bottom point denotes the day low. The horizontal line at the left means the price at which stocks opened today. The rightmost mark on a bar chart shows you the trading price of an asset at the end of the day.

Candlestick chart

Candlestick charts are a type of financial chart that is used to show the opening, closing, high, and low prices of a security over time. A candlestick chart is composed of two parts: the body and the shadows. The body represents the opening and closing prices, while the shadows represent the high and low prices. A hollow or filled part of a candlestick represents that the closing price was lower than the opening price (a bearish trend). A solid part of a candlestick represents that the closing price was higher than the opening price (a bullish trend).
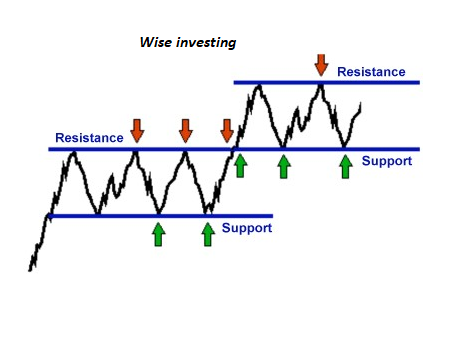
What Is Support & Resistance
Support and resistance are two key concepts in technical analysis. Support is a level at which the price tends to find buyers, and resistance is a level at which the price tends to find sellers. The support level is where most traders place their stop-loss orders because it is seen as the point where a stock will stop falling. The resistance level, on the other hand, is where many traders place their limit orders because it is seen as the point where a stock will stop rising.
An indicator is a technical analysis tool that shows the current direction of a market. Traders use these indicators to identify potential trends and make profitable trades.
There are many different types of indicators that can be found in technical analysis. These indicators are used to measure the strength or weakness of an asset. Some of the most popular indicators include the Moving averages, MACD, RSI, Bollinger Bands, Stochastic Oscillator, etc.

Trend lines
Trend lines are a type of technical analysis that can be used to identify the general direction of a stock. Trend lines are drawn on a chart and show the general movement of a stock over time. This can be helpful in determining whether to buy or sell stocks. A trend line is drawn by connecting two or more points on a chart, which are typically at least three points. The line can be drawn using a variety of methods, such as connecting closing prices, moving averages or highs and lows. Trend lines can also be used to identify support and resistance levels for stock prices, which traders use when considering whether to buy or sell stocks.

Wise investing
Growth with learning
Wiseinvesting.in


Comments
Post a Comment
If you have any doubt let me know about investing & different trading ideas